6 users in guerrilla testing
They gave us the insights we needed to identify usability issues, quickly iterate, and modify what was necessary to bring a first version into production that would deliver real value to users.
The rationale: Nielsen research indicates that testing with 6 to 15 users quickly helps identify friction and iterate faster. This worked for me in this first milestone.

Something they liked
-
The new design of the Journey
-
The color palette associated with the 2Brains Design System and semantic ranges.
-
It's intuitive. There's only one place to assign interviews.
-
Dashboards by user type and with relevant information for each area.
What should be kept
-
Improved table functionality. Font sizes have been improved in places where they weren't legible.
-
Pleasant and not so saturated colors.
What users asked themselves
Whether development will bring key feature notifications for all areas and more where they intersect.
Being able to send these notifications through other channels such as email or Slack.
To be able to have a daily change control mapped and in a report within the system.
Delivery, phase 1
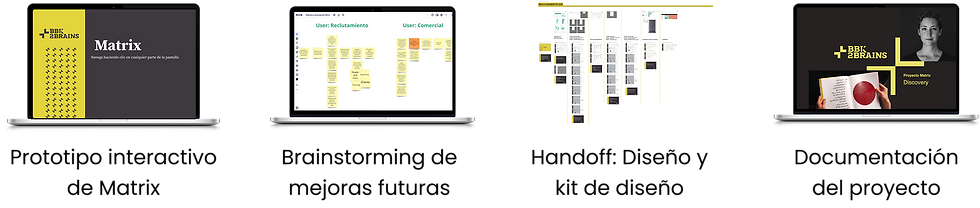
Showcase
Original system

Part of the redesign

UI Kit
More than 110 components generated in Figma with their variants, standardizing the Matrix user interface and contributing to the 2Brains Design System.

Roadmap

User Journey Map


2Brains
Matrix
Date: 2023
The Matrix project is an administrative platform for 2Brains' various internal operations in the areas of sales, recruitment, management, billing, and reporting.
🔒 Confidentiality note
This project is subject to confidentiality agreements with the company, so I cannot share final deliverables, links, or sensitive details of the product. However, I can discuss the process, methodological approach, and key learnings in private settings or interviews.
CONTEXT | RESEARCH | UX DESIGN | UI DESIGN | USABILITY TESTING | IMPACT | DELIVERY | LESSONS
Context
Objective of the initiative
Establish a work plan to redesign the Matrix platform experience: Roadmap and monitoring dashboards, defining features that enable future initiatives and make Matrix the official platform for an end-to-end view of internal operations, ensuring systematic replicability in other companies and considering the three main aspects: Commercial, Services, and People and Care.
Roles
Product Designer / UX Lead
Tool kit
Figma, Miró, paper, markers.
Research
Research objectives
-
End-to-end experience review with key information from the areas involved to improve process efficiency and effectiveness.
-
Improving the experience by incorporating vital processes that were previously manual, defining an MVP, and developing it incrementally until the digital product is complete.
-
Creation of collaborative initiatives with the technology department to verify the timing of each phase and advance in Dual Track mode.
Pain points
Inefficient system: Due to the presence of multiple platforms, work times are not optimized. The lack of real-time updates makes the system slow.
Incomplete information: Need to integrate other platforms to avoid data duplication. An end-to-end system is required that allows for complete processes to be visualized.
Usability and experience issues: Improve the look and feel and experience from a usability and accessibility perspective. Integrating the service management area with automated processes and new features is required.
Research methodologies
-
Initial kick-off to define the Digital Product
-
Interviews with 7 Platform users to verify usability errors
-
Cardsorting for Information Architecture
Kick-off
Co-definition instance with participation of stakeholders to define objectives, define project expectations, and establish working agreements, including resources, communication channels, and deadlines.

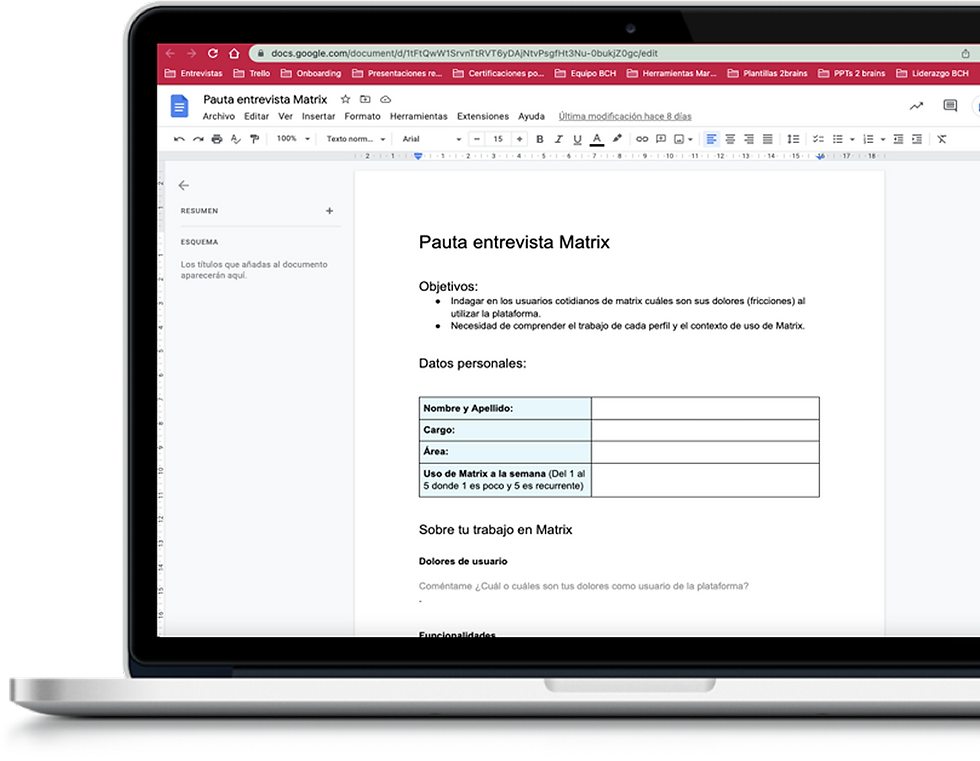
Interviews
-
7 platform users with diverse profiles
-
42% from APPS (Equally divided between people who would do so in other APPS, and in the Loyalty or Benefits Program APP)
Cardsorting for Journeys Review
-
Called by teams (Sales, Talent, Managers and Service Messenger) to verify the Journey of each type of user.

Results and experience bases
After the research process, we generate:
1. User persona: To understand user pain points, needs and motivations.
2. User journey map: To identify processes within each journey by user type.
3. The project roadmap.
User Personas

User: Commercial
The commercial profile is responsible for designing the teams and defining values for each profile.
"I need data from the ATS and HubSpot to execute processes correctly without the possibility of error."
Hours of use: 40 hours per week Sections consulted: Commercial, people and projects

User: The recruiter
Through the candidate pool, it makes visible the journey of individuals to the various application processes.
“For me, the ideal is to stop using Blake and have everything concentrated on a single platform.”
Hours of use: 40 hours per week Sections consulted: Recruitment, people and projects

User: Service Manager
Responsible for managing people during onboarding and throughout the project.
“I need visibility into the entire process, from the deal to resource allocation, and I do a lot of things manually.”
Hours of use: 40 hours per week Sections consulted: Recruitment, people and projects.

User: The manager
Analyze the company's health through data and dashboards in an advisory manner.
“I would like the Matrix to be an orchestrated system where I can be sure everyone can work there and see what's happening in real time.”
Hours of use: 2 times a week Sections consulted: Dashboards, summaries and all general sections.
Research Results
External systems
Having two external systems connected to Matrix makes the system cumbersome. It has been found that the source code could be optimized, and the information should be centralized in a single system.
Updates
Having two external systems connected to Matrix means that information is not updated immediately, resulting in duplicate information or missing information without the user's knowledge.
Visibility
It is essential that the system visualize all end-to-end processes so that all involved areas can consult the information effectively.
Usability improvements
It is necessary to create a Design System where accessibility errors can be adjusted, and a responsive version of the system can be built.
Automate the manual
The Service Management area executes manual processes that should be automated so that other strategic areas can check the status of that information.
New features
The proposal is to improve traceability with automatic notifications, enable permissions for justified editing, automate assignments and absence calculations, and centralize interview appointments in a single location.

UX Design
Alignment of objectives and prioritization, Phase 1: Redesign.
-
Redesign at the usability level, proposing improvements for the Matrix system.
-
New UI for the system in all its flows.
-
Generate the Matrix design kit linked to the 2Brains Library.
-
Delivering a proposed solution in Figma to the development team.
-
Tool delivery with a backlog of improvement opportunities as documentation for Phase 2.
Information architecture
Defining the IA is a guide for approaching redesign projects in phases (sprints), sometimes taking each section or establishing "key" screens that should be prioritized. Without the IA diagram, it's very difficult to identify which are the most important sections and how many screens should be planned.

Rethinking Information Architecture:

Wireframes
Sketches of the first wireframes, considering usage scenarios in the registration flow.

UI Design
60 high-fidelity screens make up Matrix
After the UI Inventory, 60 screens needed to be redesigned. They were separated into the flows for each user type.
%206_05_55%E2%80%AFp_m_.png)
%206_06_37%E2%80%AFp_m_.png)
%206_06_49%E2%80%AFp_m_.png)
%206_06_23%E2%80%AFp_m_.png)
Usability testing
Impact
+60 screens
It was the redesign of the System
Fixing various usability issues and improving accessibility.
New: UI Kit Matrix
More than 110 components in Figma
They also joined the 2Brains Consulting Design System.
Learnings
-
Many times, design decisions that can be made and that can impact vital metrics, no matter how simple they may seem, warrant usability testing.
-
Identifying the maturity level of the UX discipline in your business helps you make decisions, such as determining at what level results should be shared in order to highlight the importance of the area and the value we add when building digital products.
-
Data-driven mentality, since it is not just thinking about metrics for the sake of it, but based on a "Why?"
-
Important decisions that are brought to managers and stakeholders, if accompanied by research and supporting data, enable them to take the proposed strategic direction.
-
Developers are your allies. A good team relationship must be cultivated for effective development.